Table of Contents
Cratering (SMART)
Welcome to the laboratory component of the Science Mathematics And Research Training program here at the University of Chicago.
In this laboratory exercise you will conduct an experimental investigation to determine how the size of an impact crater depends on the energy of the projectile which created it. Over the course of the lab you will gain experience in the process of conducting Scientific investigation into a physically complex phenomena including;
- identifying the relevant physics involved in the phemomena,
- formulating a mathematical model of how the physical parameters of the problem might be related to one another,
- developing and testing an experimental procedure for testing the model,
- conducting the experiment,
- comparing your experimental results to the model,
- using your model to predict the size of a crater produced when a 500g mass is dropped from the 3rd floor of this building into a bucket of sand on the 1st floor.
- performing an experiment to test your prediction.
Crater formation is a complex process, and it isn't obvious that one would be able to learn much about it from a small tabletop experiment. However, by making a few assumptions about what happens to the kinetic energy of an impactor after it strikes a surface and by applying dimensional analysis, we can come up with a simple model for how crater diameter scales with the kinetic energy of the impactor.
In this lab, you will use small impactors (steel ball bearings) on sand to explore this model and to see if your model can be applied to estimate the kinetic energy responsible for creating some of the largest craters discovered on Earth.
Introduction: Modeling crater size
Craters are abundant throughout the solar system. Earth's moon and the surface of Mercury are both heavily cratered. On Earth, erosion effects tend to erase craters over geological time scales. Nevertheless, there exist numerous relatively young craters on Earth. The Chicxulub crater just off the Yucatan peninsula is one of the largest impact craters on Earth, and its creation is thought to be the cause of the mass extinction which wiped out the dinosaurs. Parts of the Nevada Test Site are covered in craters from nuclear weapons tests conducted mostly in the 1950s.
In a nutshell, craters are formed when the kinetic energy of the incoming object – $K=\frac{1}{2}mv^2$, where $m$ is the impactor's mass and $v$ is its velocity – is converted into some other form(s) of energy as the object comes to rest. The ways an impactor loses this kinetic energy include deformation (i.e. pushing the surface down and out of the way), ejection (i.e. pushing material up and out of the crater), heating (i.e. raising the temperature of the surface material or impactor), comminution (i.e. crushing the surface material into smaller bits), or generating seismic waves (i.e. turning the kinetic energy of the impactor into propagating wave energy of the surface material).
In certain cases, only one of these processes may dominate and it becomes easier to think about how a crater is formed. In such cases we can use a technique called dimensional analysis to create a model for how crater size depends on the impactor's kinetic energy.
Note that this is an important part of scientific research. Often times we are interested in gaining insight into phenomena which are too complex to develop a complete and rigorous mathematical model. In these situations scientists look for ways to simplify the problem by isolating parts of it which are easier to work with. Over time it is possible to build up a more complete description of the phenomena in this manner.
For this experiment, we will consider two such models.
Why not just use kinematics?
In theory, we could use what we know about Newtonian physics to predict what would happen. In fact, if we were to examine any individual grain of sand, we could use kinematic relationships to predict where it would travel after the impact.
In practice, knowing the location and physical properties of millions of grains of sand is not feasible. And in the event that it were possible, the resulting equations would almost certainly not have any analytical solution (i.e. some equation that would predict the exact outcome for any starting configuration).
To side-step this problem, we can instead predict bulk properties of a larger system (i.e. the size of the sand crater) through other sub-disciplines of physics, such as dimensional analysis or statistical mechanics.
Ejection Model
For the first model, we will assume that the particles which constitute the material struck by the impactor are bound loosely enough that most of the energy of the impactor goes into ejecting material from the impact site.
Assume that a spherical crater is formed by ejecting material; the size of the crater is proportional to the amount of material which was ejected. If the material has a uniform density, then the total mass of the removed material, $M$, is proportional to the volume of the crater, $V$, which is in turn proportional to the crater diameter cubed, $d^3$: $M \propto V \propto d^{3}$. (See Fig. 1.)
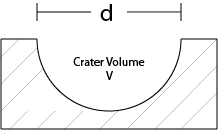 |
| Figure 1: Crater geometry |
At a minimum, the impactor must provide enough energy to lift the volume of mass completely out of the crater. (See Fig. 2.) If the mass is lifted to a height $h$, the kinetic energy is converted completely to a gain in potential energy of the crater material $U$ as $K = U = M g h$, where $g$ is the acceleration due to gravity.
Reminder: We can use the same equation $U = mgh$ for the gravitational potential energy of any object near earth's surface.
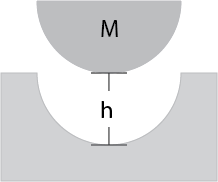
Figure 2: Lifting the volume of mass out of crater.
Assuming that the crater is spherical, the depth of the crater is proportional to its diameter: $h \propto d$. Using this and the relationship $M \propto d^3$, we have $K = U = Mgh \propto d^4$. Therefore, our first model is that the crater diameter should scale as kinetic energy to the 1/4th power: $d \propto K^{1/4}$.
| Model 1: $d \propto K^{1/4}$ |
An Alternative Model
Alternatively we could assume that most of the energy of the impactor goes into deforming the surface by pushing the material out of the way. Under this assumption we would arrive at a different model.
Assume that a spherical crater is formed by pushing surface material out of the way; the size of the crater is proportional to the amount of material which was pushed away.
Since the material only needs to be pushed out of the way (and not raised up to some height), the energy required is simply proportional to the volume which needs to be moved: $K \propto V \propto d^3$. Therefore, our second model is that the crater diameter should scale as kinetic energy to the 1/3rd power: $d \propto K^{1/3}$.
| Model 2: $d \propto K^{1/3}$ |
Procedure
We have two potential models which are quite similar. We therefore would like to design an experiment to determine which model better describes the data. Devise an experiment that allows you to measure crater diameter as a function of impactor kinetic energy. Since your ultimate goal is to distinguish between these two similar models, you will need to think about how to achieve sufficient precision and how to collect enough data to make a conclusive statement at the end of the period.
Initial observations
You have several different size steel ball bearings (impactors) and a container of fine sand of uniform grain size, along with some other pieces of equipment. Spend 5-10 minutes making some initial observations using the setup, with a focus on testing possible procedures for releasing the ball bearing and measuring crater diameters.
Your TA will lead a quick discussion, so be ready to share your observations with the rest of the class.
Hints for developing a measurement procedure
Some key points to keep in mind as you consider how to go about designing and conducting your experiment are as follows:
- How can you determine the kinetic energy of the impactors (ball bearings)?
- How can you measure the diameter of the craters formed in the sand? (As a standard for defining the edge of the crater, use the highest point of the outermost ring. Note that for larger craters, the outermost ring of the crater may be relatively flat. In these cases, use the middle of the outermost ring. See Fig. 3.)
 |
| Figure 3: Determining the diameter of a crater with a ridge ring. |
- How will you consistently release the impactors?
- What range of kinetic energies are necessary to test the model? (Since the model predicts a power law relationship between size and energy, you should cover at least 2 decades of energy.)
Decades? What do you mean?
In physics, a decade is often used to denote that something varies by a factor of 10 to some power.
For example:
- If you investigate lengths between $1\text{ cm}$ and $10\text{ cm}$, that would be one decade ($10^1$).
- If you investigate lengths between $1\text{ cm}$ and $1\text{ m}$, that would be two decades ($10^2$).
- Between $1\text{ cm}$ and $1\text{ km}$ would be a range of five decades ($10^5$).
In our case, we'd like the ratio between your smallest and largest energy to be at least a factor of 100.
Taking and visualizing data
After the discussion, you will continue taking data. Using what you learned from other groups (and using the hints above), develop a good measurement procedure.
A reminder about uncertainties
Average
If you measure something many times, the values you measure may differ a bit each time due to normal statistical fluctuations. We can therefore define the average $\mu$ (or mean) of $N$ individual measurements $\{x_i\}$ as
| $\mu = \frac{1}{N}\sum_N x_i.$ |
Standard deviation
The amount of fluctuation of your data about the average value is characterized by the standard deviation. This function looks at the difference between each point $x_i$ and the average value $\mu$ , squares that difference, sums over all data points, and takes the square root:
| $\sigma = \frac{1}{N-1}\sqrt{\sum_N (\mu-x_i)^2}.$ |
Standard deviation of the mean
The standard deviation characterize how much one measurement differs from the next, but it doesn't tell us how well we can estimate the average value. The estimate for that is called the standard deviation of the mean, $\sigma_{\mu}$, (or, sometimes called the standard error):
| $\sigma_{\mu} = \sigma/\sqrt{N}.$ |
The standard deviation of the mean decreases as you make more measurements (as $N$ increases).
Near the end of the period, the TA will bring the group together for a discussion of your results. Be ready to share your measurements!
Making predictions with your model
After you have collected data the TA will make a plot containing the data from each group, they will then use corve fitting software to determine the power law relationship which best fits your data.
The TA will lead the class out into the hallway to do an experiment dropping a larger ball from larger height(s). They will help you estimate the energy, and use your model to predict the size of the crater.
Applying your model to known craters on Earth
If there is time at the end of the lab you can use the model you created today to say something about some of the large craters that exist on Earth.
Sedan Crater
Below is a Google Maps image of a portion of the Nevada Test Site where over 1000 nuclear weapons tests were conducted. You can see numerous craters formed from both above ground and below ground detonations of nuclear weapons which occurred in the 1950s. On the left side of the image is an impressive crater known as the Sedan Crater which was produced as part of Operation Plowshare to test the feasibility of using nuclear weapons for civilian construction purposes. The crater was produced by the detonation of a $10^{4}$ kiloton ($4.40 \times 10^{12}\text{ J}$) thermonuclear explosion.
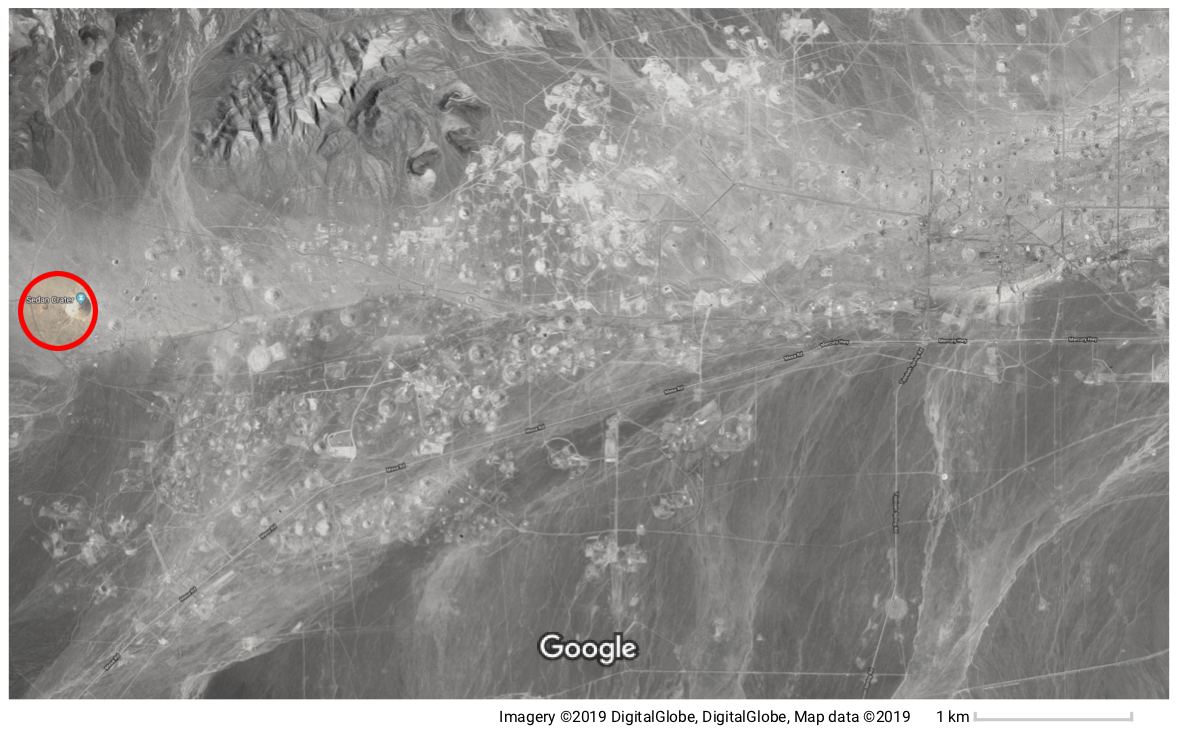
Figure 4: The Nevada Test Site with the Sedan Crater marked on the far left. (Image via Google Maps.)
Even though the crater was produced by an explosion near the surface instead of an impactor from space, we want to see if your model holds for this crater.
- Rearrange your scaling law equation so that it becomes kinetic energy as a function of diameter.
- The Sedan Crater has a diameter of 390 m. Using your rearranged scaling law, what would you predict for the energy yield of the nuclear weapon that produced it? Is the value of the same order of magnitude as the known value ($4.4 \times 10^{12}$ J)?
- Is your expected value large or smaller than the known value? Can you think of some reasons why your prediction may not match? (As a hint, think about the dominant process in your model… areas of these craters have been found to be compacted and some of the sand was heated and turned into glass. If some of the energy of the blast went into these processes, what does that mean for your prediction? Will it be too high or too low?)
Chicxulub crater
Another famous crater is Chicxulub, the crater formed by the asteroid that struck the earth around 65 million years ago causing the mass extinction of the dinosaurs (and many other species). Unlike your experiments where the impactor was dropped directly down onto the surface, it is estimated that the asteroid hit the earth at an angle of between 45$^{\circ}$ and 60$^{\circ}$ from horizontal (source: Wikipedia).

Figure 5: Location of the Chicxulub Crater on the Yucatan Peninsula in Mexico.
- The Chicxulub Crater has a diameter of about 100-150 km. Using your rearranged scaling law, what would you predict for the energy of the asteroid that produced it?
- Expert estimates – using scaling laws like yours as well as other evidence – suggest the kinetic energy of the asteroid at the time of impact was between $3 \times 10^{23}$ and $6 \times 10^{25}$ J (source: Wikipedia). Why might your prediction not agree with the expert's estimate? Is your prediction too high or too low, and is that consistent with your reasons for what may be causing disagreement?